Abstract
The pulsed laser thermal conductivity instrument (Laser Flash Apparatus) is a widely used high-precision tool in material thermal property research, employed to measure the thermal diffusivity and thermal conductivity of materials. This paper takes the DLF-1300 model pulsed laser thermal conductivity instrument produced by TA Instruments as an example to delve into its waveform analysis methods. Additionally, through an actual maintenance case, it analyzes common fault causes and maintenance procedures. The aim is to provide a scientifically rigorous reference for technicians involved in the operation and maintenance of this instrument.

Introduction
Thermal properties such as thermal diffusivity and thermal conductivity are of significant importance in materials science and engineering applications. The pulsed laser thermal conductivity method has become a common approach for studying these parameters due to its high precision and rapid measurement capabilities. The DLF-1300 pulsed laser thermal conductivity instrument from TA Instruments is an advanced measurement device widely used in both research and industrial fields. However, as usage time increases, the instrument may encounter various faults that can affect the accuracy of measurement results. Therefore, mastering waveform analysis and fault maintenance methods is crucial for ensuring the reliability of experimental data.

Working Principle of the Pulsed Laser Thermal Conductivity Instrument DLF-1300
The DLF-1300 pulsed laser thermal conductivity instrument operates by emitting short laser pulses to irradiate the sample surface, thereby generating a thermal pulse within the sample. The thermal pulse propagates along the sample’s thickness direction, and a detector (typically an infrared detector) records the temperature change of the sample over time. By analyzing the temperature-time response curve (waveform), the material’s thermal diffusivity and thermal conductivity can be calculated.
Main Components
- Laser Pulse Source: Generates high-energy, short-duration laser pulses to excite the sample.
- Sample Stage: Secures the sample and ensures accurate positioning of the laser and detector.
- Detector: Typically a fast-response infrared detector used to record temperature changes.
- Data Acquisition System: Collects the detector signals in real-time and transmits them to a computer for processing.
- Optical System: Includes lenses, filters, and other components to guide and adjust the laser and detector light paths.
Waveform Analysis
Waveform analysis is the core part of data processing in pulsed laser thermal conductivity instruments. Precise analysis of the temperature response curve allows for the determination of the material’s thermal diffusivity and thermal conductivity. The following are the basic steps of waveform analysis:
1. Data Acquisition
After the laser pulse irradiates the sample, the detector records the temperature change of the sample surface over time. Ideally, the temperature curve should display a clear rising pulse followed by a gradual stabilization.
2. Baseline Correction
Due to environmental temperature fluctuations and device noise, the acquired temperature curve needs baseline correction to eliminate the influence of background signals.
3. Pulse Identification
Identify the position of the excitation pulse in the temperature curve and its characteristic parameters, such as pulse amplitude and rise time.
4. Calculation of Thermal Diffusivity
Based on the sample’s geometric parameters and the pulse response curve, apply thermal conduction models to calculate the material’s thermal diffusivity. Common models include the semi-infinite body model and the finite thickness model.
5. Calculation of Thermal Conductivity
Using the thermal diffusivity along with the known material density and specific heat capacity, further calculate the material’s thermal conductivity.
Maintenance Case Study
Fault Description
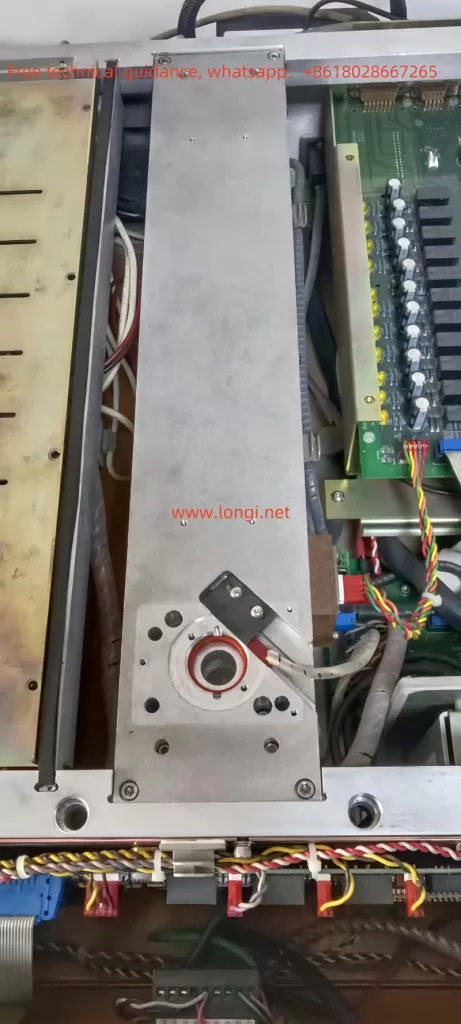
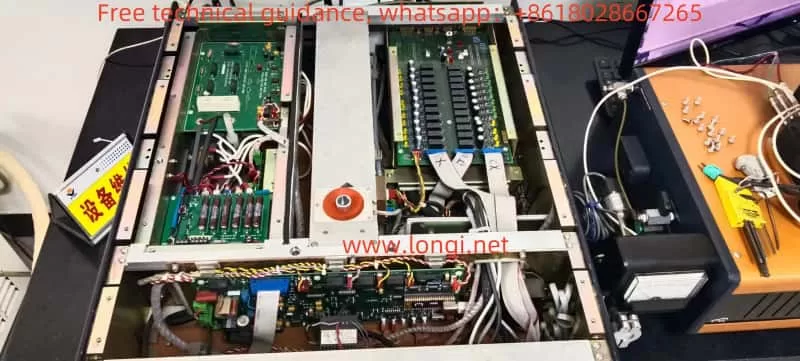
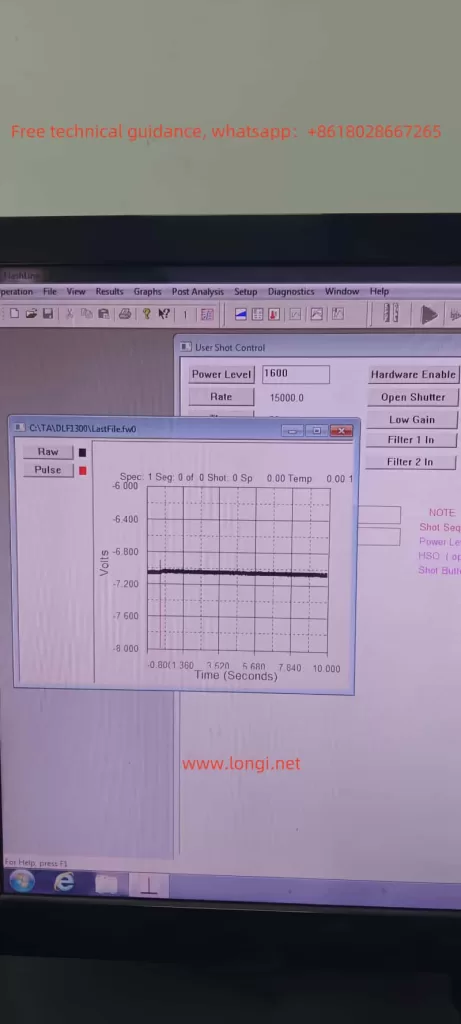
A customer reported that their 2013 model TA DLF-1300 pulsed laser thermal conductivity instrument was producing distorted test results. Specifically, the detection waveform was abnormal, and the detector was not receiving effective signals, leading to inaccurate measurements. Manufacturer’s maintenance personnel initially diagnosed the fault as a damaged laser causing abnormal energy emission.
Abnormal Waveform Analysis
Based on the three images provided by the customer, the first image displayed an abnormal temperature response curve. Under normal circumstances, the temperature curve should show a rapid rise following the laser pulse, then gradually stabilize. However, the customer’s waveform exhibited a flat signal lacking the expected rising pulse, indicating that the detector failed to capture sufficient thermal excitation signals.
Possible Causes of Abnormal Waveform
- Insufficient Laser Output: The laser pulse energy is inadequate to effectively excite the sample.
- Optical System Failure: The laser beam is not properly focused or is obstructed, preventing energy transfer to the sample.
- Detector Issues: The detector’s sensitivity has decreased or there are connection faults, preventing accurate signal reception.
- Electronic System Faults: Problems with the data acquisition system or control circuits affecting signal recording.

Maintenance Procedures
Based on the manufacturer’s technical personnel’s initial judgment that the fault originated from abnormal laser output, the following specific maintenance steps were undertaken:
1. Preliminary Inspection
- Visual Inspection: Check for obvious external damage to the laser, such as cracks or burn marks.
- Connection Inspection: Ensure that the laser is firmly connected to the optical system and control circuits, with no loose or broken connections.
2. Laser Testing
- Power Testing: Use a power meter to measure the laser’s output power and compare it to the normal range.
- Pulse Characteristic Testing: Examine the laser pulse’s amplitude, frequency, and duration to ensure they meet instrument specifications.
3. Optical System Inspection
- Laser Beam Path Inspection: Confirm that the laser beam path from the laser to the sample is unobstructed, free from dust or obstacles.
- Lens and Filter Inspection: Clean or replace any optical components, such as lenses and filters, that may be contaminated or damaged.
4. Detector Testing
- Sensitivity Testing: Verify the detector’s sensitivity to ensure it can effectively capture temperature changes.
- Connection Testing: Ensure that connections between the detector and the data acquisition system are normal and free from signal interference.
5. Electronic System Inspection
- Power Supply Check: Confirm that the power supply to the laser and detector is stable without voltage fluctuations.
- Control Circuit Testing: Use an oscilloscope and other instruments to test the control circuit signals, ensuring normal operation.
6. Replacement and Calibration
- Laser Replacement: If the laser is confirmed to be damaged, replace the laser module with a new one.
- System Calibration: After replacing the laser, perform a comprehensive calibration of the thermal conductivity instrument to ensure measurement accuracy.
Maintenance Case Summary
In this maintenance case, through waveform analysis, the technical personnel confirmed that insufficient laser output was the primary cause of distorted measurement results. After replacing the damaged laser and recalibrating the instrument, the waveform returned to normal, and the measurement results became accurate. This case illustrates the critical role of waveform analysis in fault diagnosis of pulsed laser thermal conductivity instruments. Timely and accurate maintenance can effectively restore the instrument’s normal functionality.
Common Faults and Preventive Measures
Common Faults
- Laser Failures: Including decreased output power and unstable pulses.
- Optical System Contamination: Contamination of optical components like lenses and filters, affecting laser transmission.
- Decreased Detector Sensitivity: Aging or damaged detectors leading to inaccurate signal capture.
- Electronic System Faults: Issues with the data acquisition system or control circuits affecting signal processing.
Preventive Measures
- Regular Maintenance: Periodically inspect and clean the optical system to ensure the laser beam path is clean and unobstructed.
- Device Calibration: Regularly calibrate the instrument to maintain measurement accuracy.
- Environmental Control: Maintain a stable working environment for the instrument, avoiding temperature and humidity fluctuations that may affect device performance.
- Proper Operation: Follow the manufacturer’s operation manual correctly to prevent human error from causing device damage.
Conclusion
The TA DLF-1300 pulsed laser thermal conductivity instrument is a high-precision tool for measuring thermal properties of materials, with waveform analysis playing a crucial role in fault diagnosis and maintenance. Through an actual maintenance case, this paper detailed the process of waveform analysis and maintenance, providing valuable references for related technicians. Additionally, it emphasized the importance of regular maintenance and proper operation to extend the device’s lifespan and ensure the accuracy of measurement data.
In the future, with continuous technological advancements, pulsed laser thermal conductivity instruments will further enhance their measurement precision and stability. Technicians must continually learn and master new maintenance technologies to adapt to instrument updates, ensuring greater contributions in scientific research and industrial applications.
