1. Introduction
Siemens ET200S has long been a widely deployed distributed I/O system in machine tools, logistics systems, OEM equipment, and factory automation. When paired with the IM151-8 PN/DP CPU, it functions not only as a remote I/O station but also as a compact PLC capable of running user programs and communicating via PROFINET or PROFIBUS.
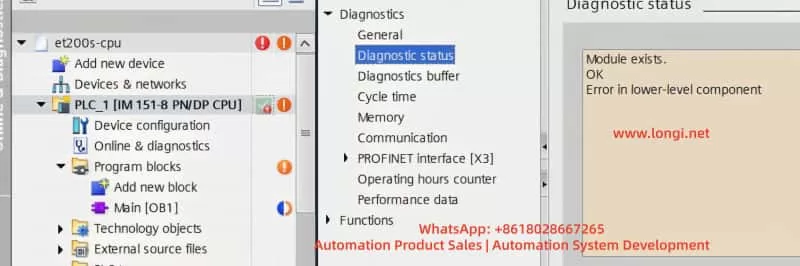
A commonly encountered diagnostic message during commissioning or troubleshooting is:
“Module exists. OK. Error in lower-level component.”
At first glance, the error appears simple, but in reality it involves a combination of hardware architecture, base unit compatibility, backplane bus communication, and TIA Portal diagnostics.
This article provides a deep technical analysis of this error based on a real engineering case, explains the internal mechanisms of ET200S diagnostics, and provides a systematic troubleshooting methodology appropriate for professional automation engineers.
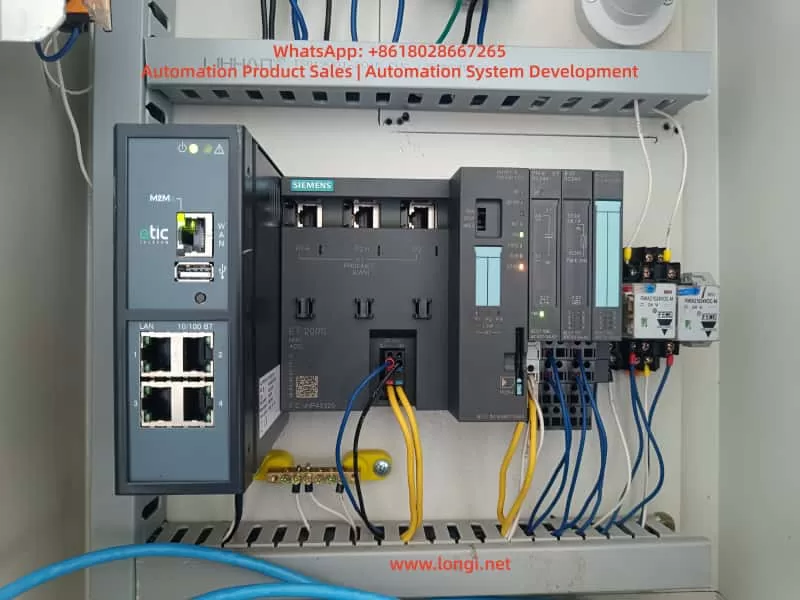
2. Architectural Overview of Siemens ET200S
2.1 Modular Design
The ET200S platform consists of three key hardware layers:
- Base Unit (BU)
Provides field wiring terminals and includes the backplane bus connectivity. - Electronic Module (EM)
Such as DI, DO, AI, AO, PM-E, Fail-Safe modules, etc. - Interface Module or CPU (IM151-8)
The IM151-8 PN/DP CPU integrates PLC functionality, PROFINET, and—depending on version—PROFIBUS DP.
The backplane bus is responsible for all internal communication between the CPU and the modules. If this bus is disrupted, the modules may still receive power, but they cannot be recognized by the CPU.
3. Diagnostic Hierarchy in IM151-8 PN/DP CPU
Siemens CPUs use a structured diagnostic hierarchy:
| Level | Diagnostic Source |
|---|---|
| Level 0 | CPU internal hardware |
| Level 1 | Local ET200S modules (PM, DI, DO, etc.) |
| Level 2 | PROFINET devices |
| Level 3 | PROFIBUS DP slaves |
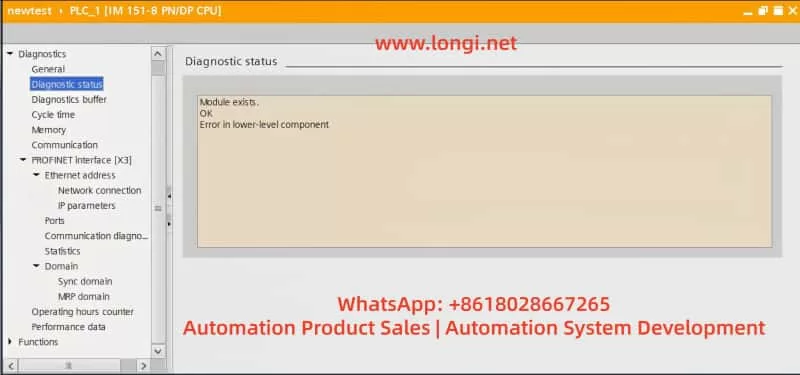
The message:
“Error in lower-level component”
belongs to Level 1.
This means the CPU itself is healthy, but something below it (local hardware) is inconsistent.
4. Mechanism Behind “Error in Lower-Level Component”
The diagnostic message in TIA Portal usually appears as:
Module exists.
OK
Error in lower-level component
This message does not mean:
- A module is broken
- A cable is loose
- The program is incorrect
Instead, it means:
The CPU detected the local station structure, but it could not match or read the module information on the backplane bus.
Common causes include:
4.1 Backplane Bus Interruptions
Typical reasons:
- Base Unit not fully seated
- Backplane connector damage
- Bent pins
- Oxidation
- Wrong BU type
4.2 Incompatible Base Unit
Different electronic modules require specific BU types.
Using an incompatible BU results in:
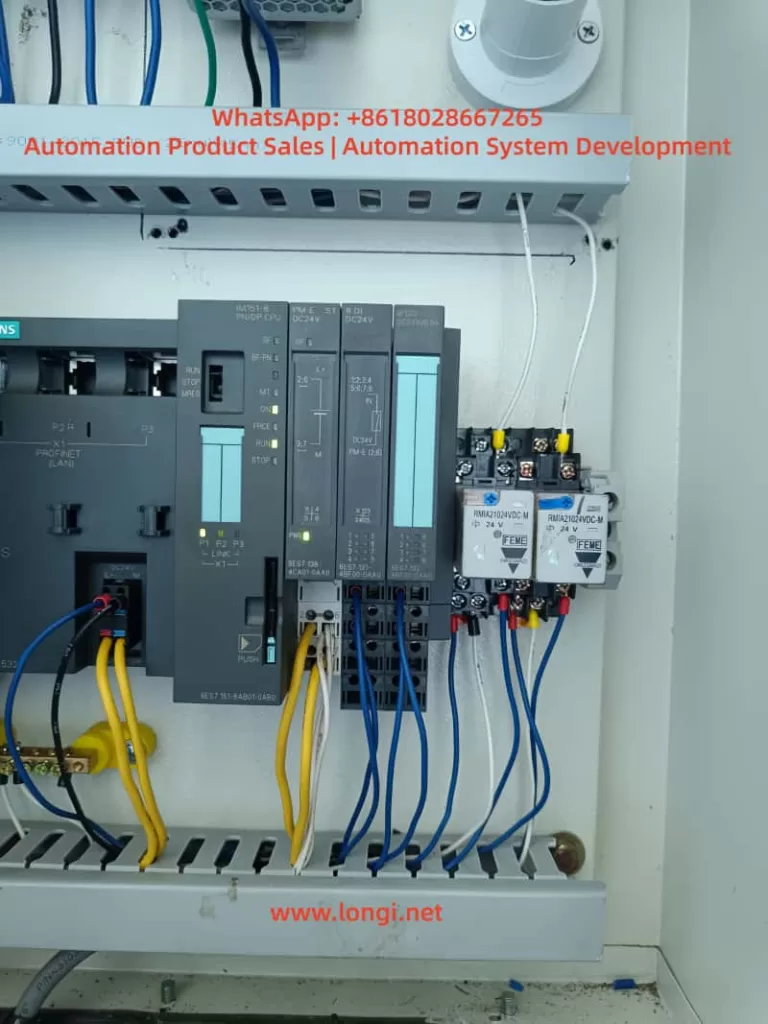
- Power LED (PWR) ON
- But the CPU cannot read the module
- Online diagnostics show “Does not exist”
- CPU issues “Error in lower-level component”
4.3 Electronic Module Damage
Modules may power up normally but fail to communicate on the backplane.
4.4 Hardware Configuration Mismatch
Offline hardware configuration does not reflect the real module lineup.
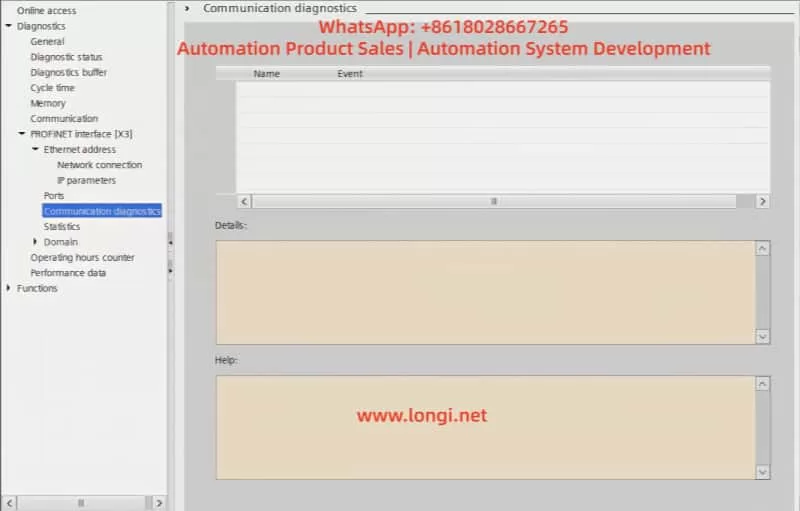
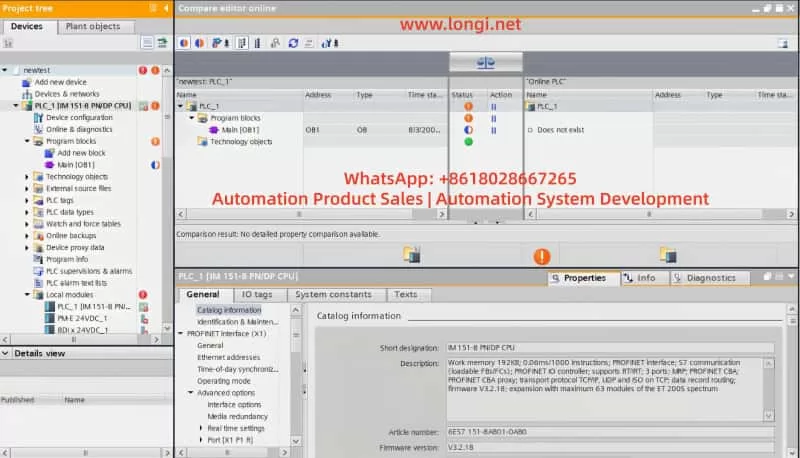
5. Using TIA Portal Compare Editor for Hardware Diagnosis
TIA Portal’s Online Hardware Comparison is one of the most powerful tools for ET200S diagnosis.
It compares:
- Offline hardware configuration
- Actual hardware detected by the CPU
Typical indicators:
| Compare Result | Meaning |
|---|---|
| Does not exist | Backplane not connected / wrong BU |
| Mismatch | Wrong module type or firmware |
| Missing module | Module not present |
| New module | Hardware added physically |
In this case study, Compare Editor returned:
“Does not exist” for the entire ET200S rack
This immediately suggests a backplane bus issue, not a program or network issue.
6. Root Cause of the Case: Wrong Base Unit Type (F-Type BU)
The user provided this Base Unit model:
6ES7 193-4CE00-0AA0
This corresponds to:
✔ BU20-F (Fail-Safe Base Unit)
Fail-Safe BUs are designed exclusively for:
- F-DI
- F-DO
- F-AI
❌ They cannot be used with standard modules such as:
- 6ES7 131-4BF00-0AA0 (Standard DI)
- 6ES7 132-4BF00-0AA0 (Standard DO)
Why?
- BU-F has a different internal pin layout
- Safety modules require additional signal paths
- Normal modules do not match this bus structure
Thus:
- DI/DO modules receive power (PWR LED on)
- But the backplane bus does not link
- CPU cannot identify modules
- Online hardware → “Does not exist”
- CPU → “Error in lower-level component”
This perfectly matches every symptom observed.
7. SDB7 Memory Error: Internal Load Memory is Full
Another unrelated error encountered:
“There is not enough memory available for download to the device. SDB7”
Key facts:
- IM151-8 uses fixed internal load memory
- The memory card does not expand PLC program memory
- Excessive system blocks, old projects, HMI tag DBs, or unused libraries can exceed capacity
- Solution:
- MRES reset
- Erase all
- Download HW first, then logic
- Remove unused blocks
8. Engineering Troubleshooting Workflow (Recommended)
Step 1 — Verify Base Unit Model
Ensure BU type matches EM type:
- Standard DI/DO → BU-P
- Fail-Safe DI/DO → BU-F
- PM-E → BU-P
Step 2 — Reseat All Modules
Press modules firmly until they click into place.
Step 3 — Online Hardware Comparison
Identify backplane or BU faults quickly.
Step 4 — Isolate Module Groups
Connect only PM-E first; then add DI/DO modules sequentially.
Step 5 — Clean CPU Memory if Necessary
Resolve SDB7 errors before downloading.
Step 6 — Inspect PIN Connectors
Backplane connectors are sensitive to mechanical damage.
9. Engineering Lessons Learned
9.1 Base Units Are Not Interchangeable
BU types are specific to categories of modules.
9.2 PWR LED Does Not Guarantee Module Function
Backplane communication is independent from power supply.
9.3 Compare Editor Is Essential
It reveals hardware-level mistakes that are invisible through standard diagnostics.
9.4 IM151-8 Diagnostics Require Layer Awareness
Understanding which diagnostic level is affected avoids misjudging the cause.
10. Conclusion
The error message:
“Error in lower-level component”
is not a generic failure.
It is a precise diagnostic indicating:
- The local ET200S station structure is inconsistent
- The CPU cannot read modules correctly on its backplane bus
In this case, the root cause was not cabling, software, firmware, or communication, but a hardware assembly issue:
Wrong Base Unit (BU20-F) used with standard DI/DO modules
By understanding:
- ET200S internal architecture
- Backplane bus mechanism
- BU-to-module compatibility
- TIA Portal Compare Editor behavior
Engineers can rapidly diagnose similar issues in the field.
This case demonstrates that the key to reliable automation systems lies not only in programming logic but also in a deep understanding of the hardware foundation that supports it.