
1. Introduction
In modern industrial automation, Siemens SINAMICS S120 drives are widely employed across various applications such as CNC machine tools, textile machinery, printing presses, papermaking equipment, robotics, and other sectors demanding high dynamic performance and precision. SINAMICS S120 offers a modular design, advanced control capabilities, and a robust diagnostic system. When an abnormal condition occurs or when the drive simply wishes to notify the user of a particular state, it displays corresponding alarm or fault codes on the Basic Operator Panel (BOP), in the STARTER/TIA Portal software, or on an external HMI (Human-Machine Interface).
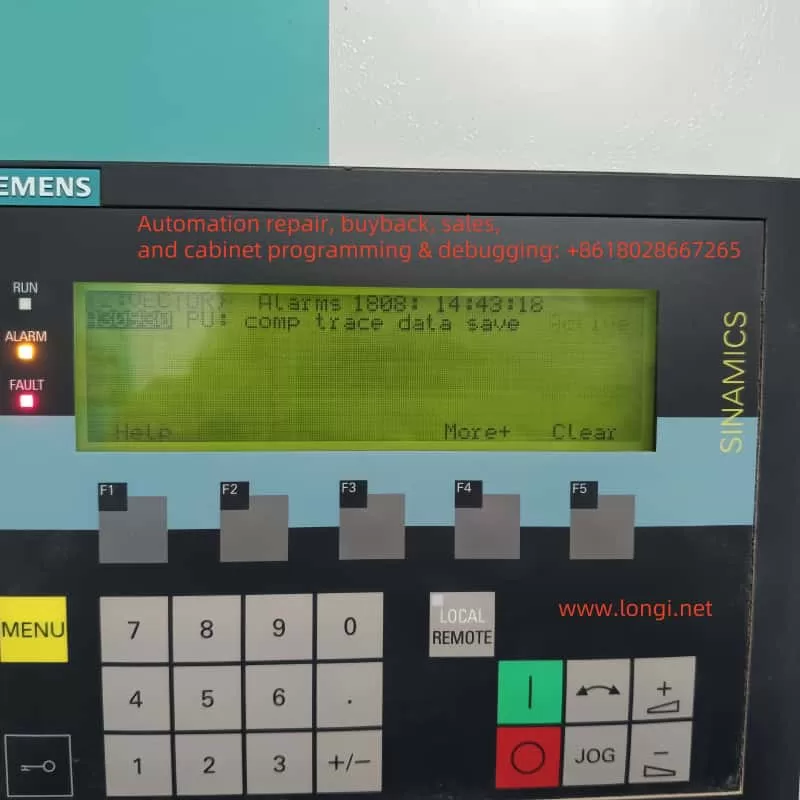
Among the many potential fault and alarm messages, Alarms 1080—often accompanied by the text “comp trace data save”—commonly appears in actual usage. Some engineers or first-time users of S120 may misinterpret this alarm as a sign of major damage or serious malfunction. However, Alarms 1080 is typically an information-level or process-level alert, indicating that the drive is saving trace (data logging) information. It is neither a hardware breakdown nor a critical fault demanding immediate shutdown. Understanding and properly handling this alarm is important for maintaining the stability of the drive system and prolonging equipment life. This article will thoroughly explain Alarms 1080’s background, implications, and recommended actions.
2. Definition and Background of Alarms 1080
2.1 Overview of the Trace Function
Siemens SINAMICS S120 includes a built-in Trace (data logging or “oscilloscope”) feature. This function records specified operating parameters or signals (e.g., current, speed, position feedback, torque commands) within the drive’s memory. When the Trace function is enabled—either manually by the user in the engineering software (STARTER or TIA Portal) or triggered automatically by certain system conditions—these signals are sampled at set intervals or in response to defined triggers. The sampled data is then stored in the drive’s internal memory or on a connected storage card (such as a CF card).
Once the sampling cycle or trigger condition is completed, the drive writes or finalizes the captured data. During this process, the drive issues a notification to indicate that it is actively saving data. This valuable dataset can later be analyzed to optimize control parameters or diagnose intermittent or complex errors.
2.2 What Alarms 1080 Signifies
When you see Alarms 1080 with a description along the lines of “comp trace data save” or “Trace data is being saved,” it specifically indicates that the drive is performing the data save operation for an active Trace task.
- This message does not imply hardware damage or a system crash.
- It is typically a “system event” or “user-level” notification that does not disrupt the drive’s primary function.
2.3 How It Differs from Fault Codes
Unlike “Fault” codes (e.g., F07802, F30003) prefixed with “F,” which usually shut down or block the drive until reset, an alarm such as Alarms 1080 does not force the drive into a faulted or disabled state. Serious faults typically demand manual acknowledgment or system logic to reset them; meanwhile, Alarms 1080 is more akin to an informational prompt. Once data saving completes and no other higher-level issues exist, the system will clear or deactivate the alarm automatically.
3. Common Causes and Scenarios
In practice, Alarms 1080 (“comp trace data save”) most often arises from these scenarios:
- Manually Enabled Trace During Commissioning
In many cases, an engineer sets up a Trace task in STARTER, TIA Portal, or directly on the panel to diagnose specific motor or drive behavior. For example, if you want to observe speed-loop responses or current-waveform patterns, you configure sampling frequency, trigger conditions, and the signals to track. As soon as the sampling finishes, the drive writes the data to storage, resulting in Alarms 1080. - Automatic Background Trace
Some drive configurations automatically initiate the Trace function for advanced monitoring or “fault logging.” When the system detects certain threshold conditions or a fault event, the drive begins collecting data. Once the event is captured, it proceeds to save it, displaying Alarms 1080 in the process. - Leftover Trace Settings
In some projects, the Trace function was used at one point but never deactivated. Even after the main commissioning is done, the drive may still be periodically recording data and subsequently saving it, inadvertently causing recurring Alarms 1080 messages. Though typically benign, these messages might raise questions among less-experienced personnel.
4. Impact on System Operation
Because Alarms 1080 is an informational or process-level alert, it does not necessarily prevent normal drive operation or motor control, as long as there are no simultaneous major fault codes. However, keep in mind the following:
- Do Not Interrupt Power During Saving
If the drive is in the middle of saving Trace data and power is lost or intentionally shut off, it may lead to incomplete data or, in rare cases, corruption of the storage medium. In general, it is best to avoid powering down the drive while Alarms 1080 is active unless absolutely necessary. - Resource Consumption
The Trace function may consume a portion of the drive’s internal resources, including CPU and memory. Although typically minimal, high sampling rates combined with large data sets can create significant overhead. If the user no longer needs Trace data, disabling it can free up resources. - Parallel Occurrences with Faults
If a severe drive fault (e.g., F07802 “Infeed Not Ready”) appears alongside Alarms 1080, the fault should take priority for troubleshooting. Alarms 1080 in that case merely indicates that trace data related to the fault was captured or saved, but it is not the cause of the fault itself.
5. Handling and Disabling Methods
When you see Alarms 1080 on the drive, and you confirm that a Trace save is in progress, you can use the following approaches to manage or eliminate it:
- Wait for the Save to Complete
Typically, the drive only needs a short interval—ranging from a few seconds to maybe a minute—for large data sets—to store the captured Trace data. The alarm will then disappear on its own once the operation finishes. - Deactivate or Remove Trace Tasks
If data logging is no longer required, you can open the Trace or Recording screen in STARTER or TIA Portal, locate any active Trace configurations, and disable or delete them.- Certain drive operator panels (like BOP20) may also allow you to view or halt ongoing Trace recordings if the firmware supports it.
- Check Storage Space and Write Permissions
Occasionally, if the alarm persists, the storage medium (internal memory or CF card) might be full, write-protected, or otherwise inaccessible. Ensure you have enough free space or switch to a larger-capacity CF card if needed. - Reset Alarms If Needed
Usually, purely informational alarms clear automatically without requiring a reset. However, if Alarms 1080 coincides with an actual Fault, you may need to perform a fault reset (via the panel or a higher-level controller) after addressing the underlying issue.
6. Common Questions and Answers
Q1: “Does the presence of Alarms 1080 mean the drive is damaged?”
A1: Not at all. Alarms 1080 almost always indicates that the drive is recording or saving Trace data, not that any component has malfunctioned. If no additional serious alarms or faults are active, the system can continue operating normally.
Q2: “Will repeatedly seeing Alarms 1080 negatively affect the system?”
A2: In most cases, no. It simply appears whenever trace-saving occurs. Unless you are sampling enormous volumes of data at high frequencies, system performance typically remains unaffected. If you do not need the Trace feature, consider disabling it to keep messages streamlined.
Q3: “How do I check Trace configurations or the storage location?”
A3: Within STARTER or TIA Portal, navigate to the corresponding drive object, and look for “Trace” or “Recording” in the function tree. There, you can view and edit active tracing tasks. On certain operator panels, you might find a Diagnostics → Trace Logs menu that shows ongoing traces and storage status.
Q4: “What else can the Trace function be used for?”
A4: Beyond fault diagnosis, the Trace feature is invaluable for capturing transient oscillations, optimizing control loops (like speed-loop gains or filter time constants), and logging multiple signals simultaneously. It helps improve control accuracy and pinpoint root causes of sporadic or short-lived anomalies.
7. Case Study
Consider a textile production line where an engineer needs to diagnose oscillations in the S120 drive. By enabling two Trace channels (one for current loop, one for speed loop) at a high sampling rate, the system collected large volumes of data. While saving these data sets, “Alarms 1080: comp trace data save” appeared repeatedly on the drive’s screen. Initially, on-site maintenance personnel feared a serious error; however, it quickly became clear that the drive was simply finalizing the recording.
Once the trace was stored, Alarms 1080 cleared by itself. Analyzing the newly captured data, the engineer discovered a PID tuning issue. By fine-tuning the relevant parameters, they significantly reduced mechanical vibration. This real-world experience illustrates how Alarms 1080 is part of a normal diagnostic workflow and can be harnessed for performance improvements rather than being an indication of a critical failure.
8. Conclusion
In summary, Alarms 1080 (“comp trace data save”) in the Siemens SINAMICS S120 drive primarily indicates the system is saving Trace data—a process-level or informational message rather than a hardware or software malfunction. Proper use of the Trace function can substantially enhance commissioning and fault diagnosis, making it possible to observe internal drive states and parameter changes in great detail. If you do not need data logging, you can disable or remove the trace configuration to prevent recurrent alarms.
If a severe fault (e.g., an “Fxxxx” code) accompanies Alarms 1080, prioritize investigating the fault itself. Ensure power and wiring integrity, confirm that no IGBT or module fault exists, and only then determine whether to proceed with or discontinue trace logging. But in the absence of critical errors, Alarms 1080 simply signals that the drive is working as intended to capture and save valuable diagnostic data.
By correctly recognizing Alarms 1080 and using it appropriately, maintenance and commissioning personnel can leverage the drive’s powerful built-in diagnostic capabilities without undue worry. This alarm can assist with targeted data capture, enabling users to optimize performance and quickly resolve intermittent failures. We hope this article clarifies the nature of Alarms 1080 in SINAMICS S120 and helps you confidently manage and benefit from its Trace functionality in real-world industrial scenarios.